Introduction
The world is full of things that 'happen by chance'. Chance and probabilty is about the likelihood of something (an event) happening. Like rolling a 3 on a dice. Can you think of some everyday activities that are likely or unlikely to happen? What is the probability of an event happening today?
Task
Your task is to design and conduct a chance and/or probability experiement. You will need to decide what activity to test, i.e. what is the probabilty that each person has a favourite colour? Or what is the probability that you will pick a blue marble out of a bag that has 5 yellow marbles, 8 orange marbles, 6 green marbles and 9 blue marbles? Collect the results from your question/activity and show them in a relevant table or graph.
Process
Lesson one:
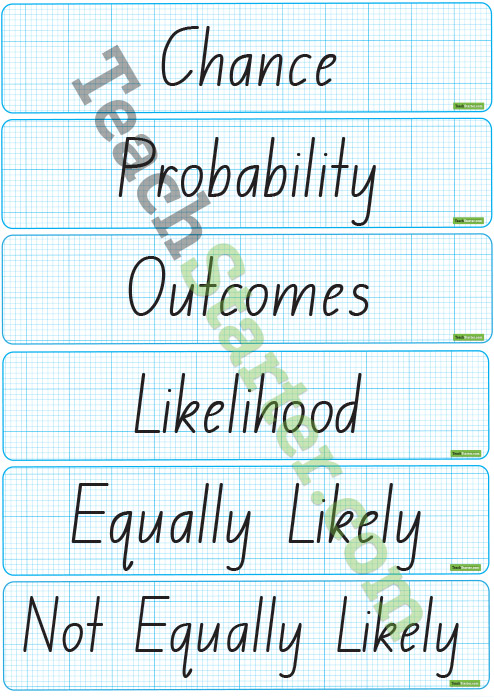
Familerise yourself and your partner or group with the words of chance.
Create a number line in your workbook using and matching the following words to their matching fractions:
Likely,
Unlikely,
Possible,
Impossible,
Certain,
0,
1/4,
1/2,
3/4,
1
www.teacherstarter.com www.mathsisfun.com
Lesson Two and Three:
Create a question, something that allows you to ask 'what the likelihood of an event occuring is?'
When you have created a question, develop some theory's about what may happen.
Use phrases such as 'I believe' or 'I think' or even 'If I did this, that may happen'.
www.maths.org www.everythingmaths.com.za
Lesson Four, Five and Six:
Create a table to write your results as you complete the experiement.
Conduct your experiement.
Write your results down in your table as you get them.
For example:
As flip the coin tally how many heads and/or tails you got.
| Heads | Tails | |
| Number of times shown when flipped | llllll | lllllllllllll |
Lesson 7:
Choose an appropriate graph type.
- Pie graph
- Line graph
- Column graph
- Bar Graph
Create your graph on graph paper using your data from your experiement.
Lesson 8:
Write a summary of your findings, making sure to refer back to you table.
In a class discussion talk about:
- the difficulties of creating a chance/probability question,
- what issues, if any, did you come across while conducting your experiement,
- did the practical results match you hypothesis or were your theories very different to your actual results.
Evaluation
|
|
Exemplary |
Effective |
Minimal |
Unsatisfactory |
|
Class and group discussions |
Contributes to group and class discussion by providing relevant information and asking appropriate questions. Challenges ideas and summarises information clearly and concisely. |
Contributes to group and class discussion on a regular basis and is fairly consistent with asking questions and providing relevant information. Attempts to summarise information and confirms ideas. |
Contributes a little and contributes basic ideas and little to some relevant information to the discussion. Attempts to confirm ideas and provides a sentence or two to summarise thoughts. |
Has little to contribute to the group and class discussion. When contributes information is not relevant. Makes no effort to confirm ideas and shows little ability to conclude their findings. |
|
Chance question |
Has used correct language. The question has been formed in a way that allows the students to theorise and to complete the activity/experiment. |
Has attempted to use language appropriately. The question has been formed in a way that allows some theorising and allows students to complete the activity/experiment.
|
Has not used language appropriately. Has attempted to create a question. Does not allow for various theories to be voice and is a simple activity to complete |
Has not used chance language at all. The question formed is not relevant or has not attempted to create a question. |
|
Tables and graphing (representation of data) |
The tables created to record the results are clear, concise and show visual fluency. They show relevant headings and information. Has selected an appropriate graph and created it with correct information from their table. |
Has created a table with the correct information and basic headings. Has created a graph with the information collected. |
Has attempted to create a table with irrelevant information. Has attempted to create a graph from the information in the table. |
Has not attempted to create a table or graph. |
Conclusion
How many everday activites did you find that involved chance? Did you use any of these to create your experiement's question? In your summary did you use chance and probability language?
What was your favourite part of the topic?
Was it:
- creating the question and theorising,
- completing/conducting the practical experiement,
- creating the graphs and summarising your findings.
Credits
Resouces:
Common items that will be needed to complete the experiement:
- Coins,
- Marbles,
- Counters.
Some questions may not require a hands on test but the children may need to ask questions of their peers, such as 'did you brush your teeth this morning?', to find out whether it more likely that a person would brush their teeth or not.
Workbooks to record their information in could be as simple as their regular Maths book or a small notebook set aside for the task.
Teacher Page
Year 3 Chance Strand
Conduct chance experiments, identify and describe possible outcomes and recognise variation in results (ACMSP067)
Year 3 Data representation and interpretation strand
Collect data, organise into categories and create displays using lists, tables, picture graphs and simple column graphs, with and without the use of digital technologies (ACMSP069)
The above strands were the focus for this topic and come from ACARA, Year Three Maths, Chance and Data representation and interpretation.