Introduction
2.MDA.10 Draw conclusions from t-charts, object graphs, picture graphs, and bar graphs.
During this webquest, you will be looking at a series of graphs and charts and asked to anwser questions.
This webquest is for 2nd grade.
After this webquest, the student would be able to use graphs and anwser questions related to that graph.
Task
Answser the following questions based off of the given graph or chart.
Process
http://wikieducator.org/images/c/c7/Bargraph.jpg
1. How many birthdays are in the month of May?
2. How many birthdays are in the month of December?
http://intermath.coe.uga.edu/dictnary/images/stats/tvbar.gif
3. How many students watched 3-5 hours of television?
4. How many students watched 12-14 hours of television?
https://www.eduplace.com/math/mw/background/2/03/graphics/ts_2_3_wi-2.gif
5. How many cats are in the graph?
6. How many dogs are in the graph?
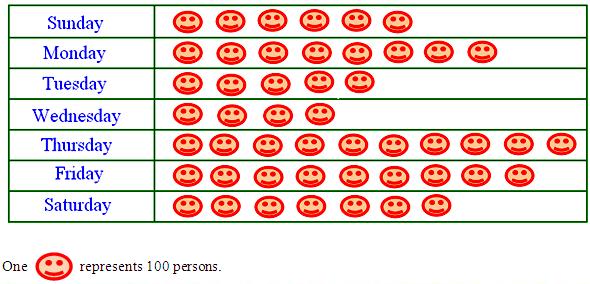
7. How many people smiled on Friday?
8. How many people smiled on Tuesday?
http://study.com/cimages/multimages/16/pie_chart_1.JPG
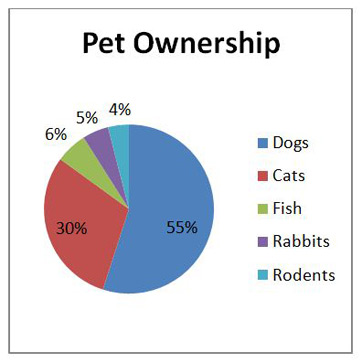
9. How many people own cats?
10. How many people own rabbits?
http://www.ciese.org/curriculum/weatherproj2/images/graph_circle.gif
11. How many days will it rain?
12. How many days will it be sunny?
Evaluation
The questions will be evaluated either as correct or incorrect.
Conclusion
After completing the webquest the student should be able to anwser questions from different graphs, and be able to read different graphs.
-Additional help
Credits
Image 1- http://wikieducator.org/images/c/c7/Bargraph.jpg
Image 2-
http://intermath.coe.uga.edu/dictnary/images/stats/tvbar.gif
Image 3- https://www.eduplace.com/math/mw/background/2/03/graphics/ts_2_3_wi-2.gif
Image 4-
Image 5- http://study.com/cimages/multimages/16/pie_chart_1.JPG
Image 6-
http://www.ciese.org/curriculum/weatherproj2/images/graph_circle.gif
Image 7-http://africasacountry.com/wp-content/uploads/2015/04/yellow-star.jpg