Introduction

Are you living a balanced life? Do you play more than you study? It is important that you know how to manage your time wisely in order to live a healthy life?
Let's find out!
Task
Your group will be making a graph about how you spend your time in a typical school week and then share it with the class.
Process
Follow these steps to complete your graph:
1. Prepare these items:
- A3 Carton paper (preferably in color)
- White sheet of paper
- Colored markers / pencils / crayons
- Origami Paper
- Ruler
2. Discuss with your group how you spend your time in a typical week (school, study, exercise, friends, family, play computer/online games, etc).
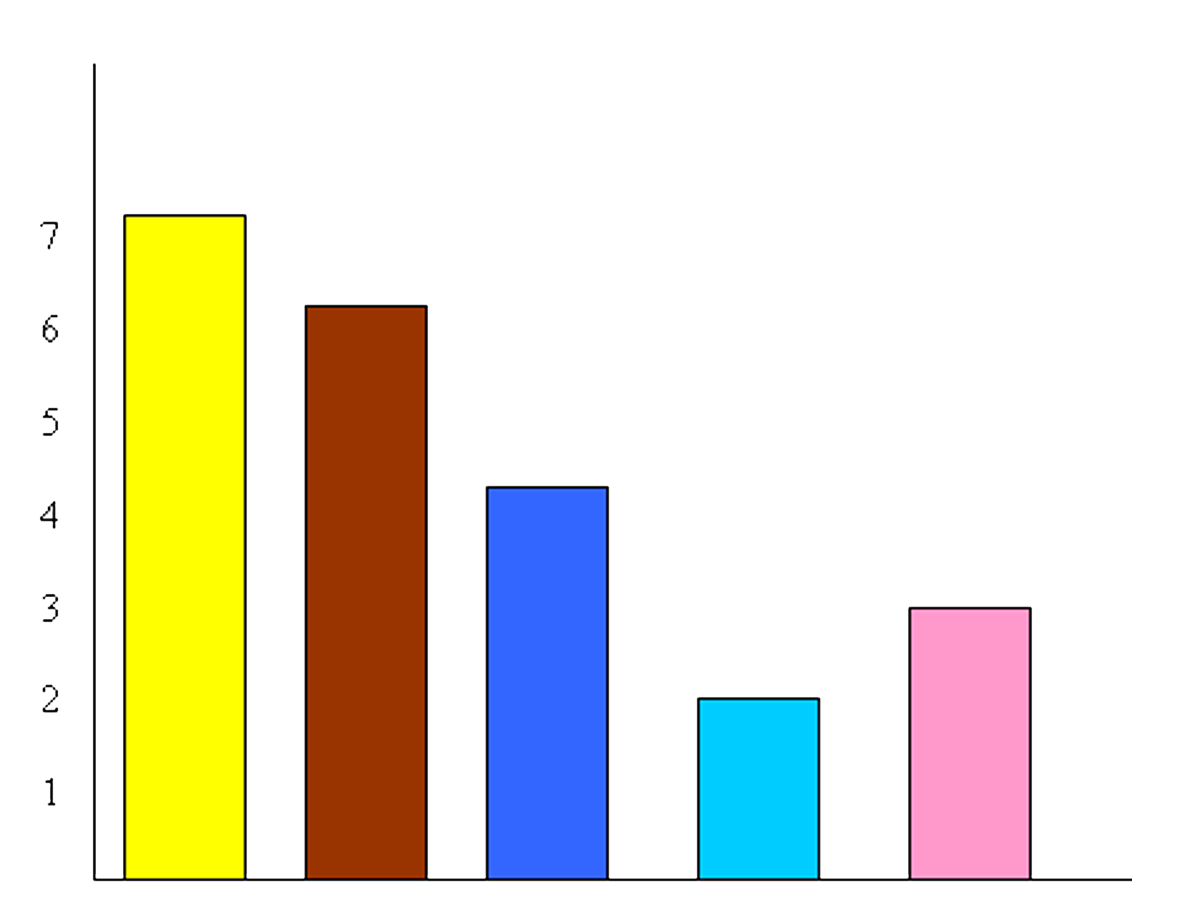
3. Draw your bar graph in a white sheet paper. You can color the graphs or you can use origami paper. After that, paste it on the colored carton paper
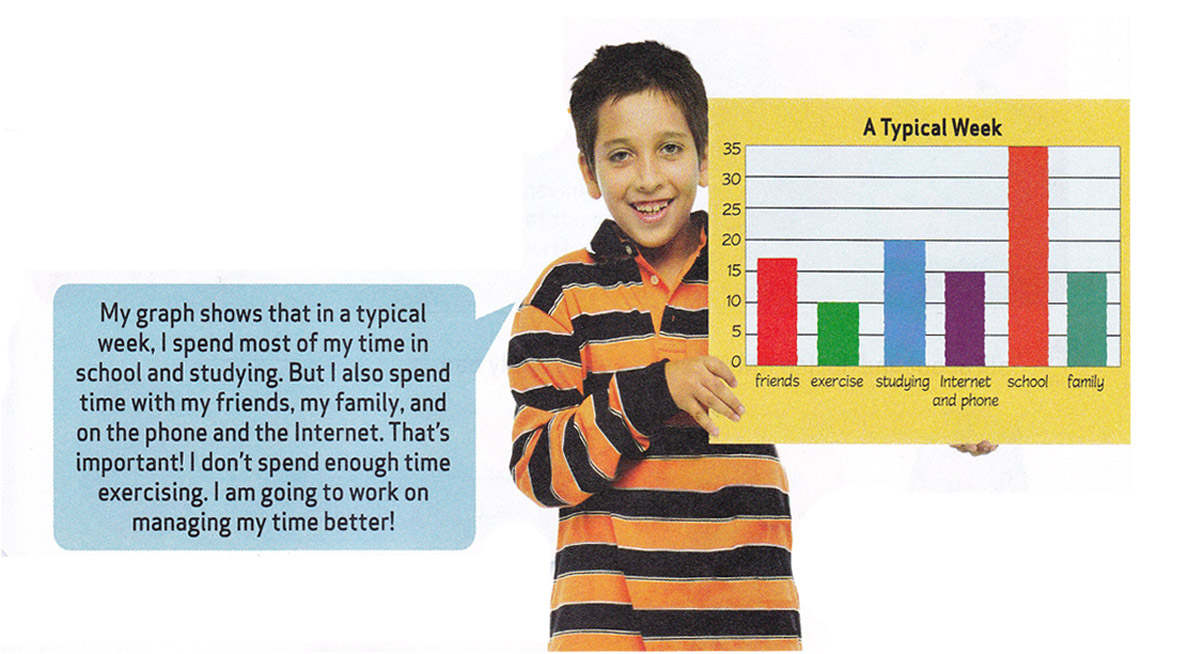
4. Your graph should look like the picture below:
4. On the vertical axis you should label it "Number of Hours" and on the horizontal axis, you should lable it "Activities."
Examples:
Evaluation
You will be evaluated in these areas:
| Very Good | Good | Satisfactory | Needs Improvements | |
| PERFORMANCE | Students maintain eye contact with audience. Perfect tone when presenting | Students maintain eye contact most of the time. Sometimes do not speak clearly. | Students occasionally uses eye contact, but still read most of the project. Often do not speak clearly. | Students present all of project with no eye contact. Do not speak clearly. |
| CONFIDENCE | Students appeared well-prepared, confident and comfortable | Students seemed fairly comfortable and confident, but needs a bit more practice | Students seemed somewhat prepared, but need more practice to build confidence | Inadequate preperation. Need practice to build confidence. |
| LANGUAGE USED | Students use a wide range of vocabulary correctly to express ideas. | Students use accurate vocabulary. Occasionally, errors in word choice. | Students use a fair range of vocabulary to espress ideas. | Students use limited range of vocabulary. Mostly inaccurate. |
| COOPERATION | All students contributed equally in completing and presenting the project | One student did not contribute equally in completing and presenting the project | More than two students did not contribute equally in completing and presenting the project | All students did not complete the project in a timely manner |
Conclusion

Now you know how to make a bar graph!