Introduction
Welcome to your introduction to the BLOOD FLOW!!!!
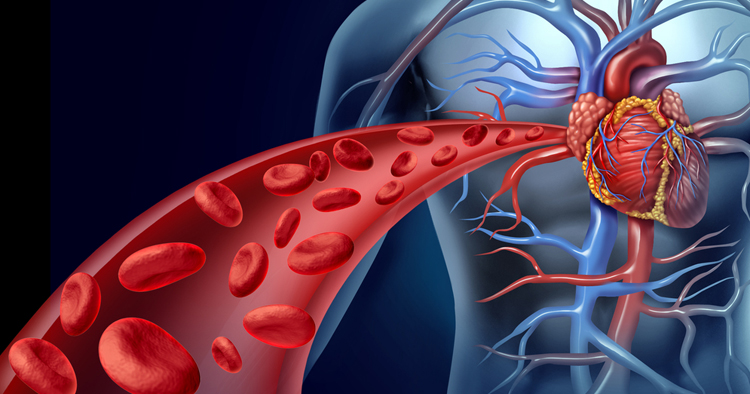
Today you will be playing scientist and using different materials to experiment on how blood flows.
Task
First you will get into 5 groups of 5 your groups are already posted on the board so look for your name and go to your group.
Each group will have a different work station with different tools to use for each category you are assigned.
These are the following catergories:
- Affects of Exercise
- Affects of Blood Pressure
- Resistance caused by disease.
- Rubber Band Blood Vessels
- Blood Volume
Materials that will be provided for you:( they will already be at your station depending on your group)
- 2 different sizes of plastic tubing
- Water
- Collection of beakers
- 2 2-liter bottles (cut out bottoms of bottle)
- Stopper for bottles or tubing (I like to use a cork with a string attached for easy removal after bottle is filled with water)
- Masking or duct tape to attach tubing to bottle
- stopwatch
- Plastic tubing or straws
- Clamps, ties, or other tubing flow restrictor
- Dough or putty could also be used to illustrate plaque
- dish soap squirt bottle filled with water
- funnel
- Paper for writing data
Process
Station 1 - Affects of Exercise
Materials:
- stop watch
- Paper for writing data
Take your heart rate by:
- Placing two fingers on your wrist (or your carotid artery, right behind the jawline in your neck)
- Count the number of beats that occur in 1 minute (use the timer on your cell phones)
- Record the information on a piece of paper by the name of the student.
- You can designate one person to write this information down
- You can designate one person to write this information down
- Jog in place for 1 minute
- Repeat steps 1 and 2, then record your heart rate again and see the difference
- Everyone in your group must participate
Station 2 – Affects of Blood Pressure
Materials
- dish soap squirt bottle filled with water
- beaker to catch expelled water
- funnel
- Invert water-filled soap bottle over supplied beaker and observe how quickly water escapes without applying pressure to bottle (DO NOT SQUEEZE).
- Begin to squeeze bottle and observe and analyze how the volume of the water stream coming out of bottle is affected and how quickly water is now escaping. Make sure to catch the water in the beaker supplied.
- Use funnel to pour water from beaker back into dish bottle for next group.
- Record on your data sheet how this relates to how blood pressure affects blood flow through the cardiovascular system. Use 3-5 complete sentences.
Station 3 – Resistance caused by disease.
Materials
- Plastic tubing or straws
- Beaker of water
- Catch beaker or bowl
- Clamps, ties, or other tubing flow restrictor
- Dough or putty could also be used to illustrate plaque
- Pour beaker of water through unobstructed tubing and observe flow rate.
- Use supplied materials to constrict or otherwise obstruct your tubing.
- Pour water through altered tubing again observing flow rate.
- Record what you have observed and how this relates to the benchmark.
Station 4 – Rubber Band Blood Vessels
- Predict elasticity of blood vessels before vs. after disease by comparing old vs. new rubber bands (write few sentences or draw a picture on your data sheet to support your analogy.)
Station 5 – Blood Volume
Materials
- 2 different sizes of plastic tubing
- Water
- Collection beakers
- 2 2-liter bottles (cut out bottoms of bottle)
- Stopper for bottles or tubing (I like to use a cork with a string attached for easy removal after bottle is filled with water)
- Masking or duct tape to attach tubing to bottle
- stopwatch
- Use a stopper or cork to plug small opening of 2-liter plastic bottle.
- Fill bottle with 500mL of water.
- Remove cork/stopper and use stopwatch to measure the amount of time it takes for the bottle to empty.
- Record this on data sheet for specific tubing size (small or large)
- Repeat steps 1-4 with other tubing size
- Record on your data sheet how this relates to differing blood volume carried by different size blood vessels, tell how this factor relates to the benchmark.
[video:https://www.youtube.com/watch?v=oE8tGkP5_tc align:left]
http://lsa.colorado.edu/essence/texts/heart.html
https://www.nlm.nih.gov/medlineplus/ency/anatomyvideos/000012.htm
http://physrev.physiology.org/content/88/3/1009
[video:https://www.youtube.com/watch?v=O8ttt3M8qZM align:left]
Evaluation
|
| CATEGORY | 4 | 3 | 2 | 1 |
| Components of the report | All required elements are present and additional elements that add to the report (e.g., thoughtful comments, graphics) have been added. | All required elements are present. | One required element is missing, but additional elements that add to the report (e.g., thoughtful comments, graphics) have been added. | Several required elements are missing. |
| Participation | Used time well in lab and focused attention on the experiment. | Used time pretty well. Stayed focused on the experiment most of the time. | Did the lab but did not appear very interested. Focus was lost on several occasions. | Participation was minimal OR student was hostile about participating. |
| Procedures | Procedures are listed in clear steps. Each step is numbered and is a complete sentence. | Procedures are listed in a logical order, but steps are not numbered and/or are not in complete sentences. | Procedures are listed but are not in a logical order or are difficult to follow. | Procedures do not accurately list the steps of the experiment. |
| Materials | All materials and setup used in the experiment are clearly and accurately described. | Almost all materials and the setupu used in the experiment are clearly and accurately described. | Most of the materials and the setup used in the experiment are accurately described. | Many materials are described inaccurately OR are not described at all. |
| Data | Professional looking and accurate representation of the data in tables and/or graphs. Graphs and tables are labeled and titled. | Accurate representation of the data in tables and/or graphs. Graphs and tables are labeled and titled. | Accurate representation of the data in written form, but no graphs or tables are presented. | Data are not shown OR are inaccurate. |
Conclusion

You have officially completed your experiments I hope you not only had fun but learned something new while doing it. And I also hope you learned about the blood flowing through your body.