Introduction
This webquest is designed to help students learn how to interpret, understand, and create line graphs. 
Let's review:
All graphs need a...
-Title!
-x-axis label
-y-axis label
-scale
-interval
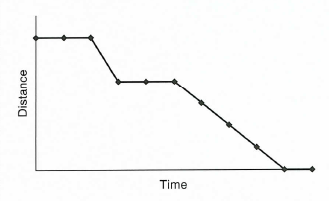
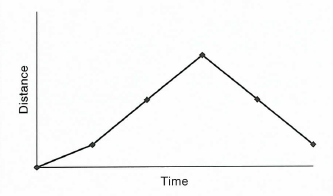
Line graphs show change over time!!
Task
For this activity you will be gathering data about the daily temperature for the week. After you've gathered your data, you will makea a line graph representing that data.
You will use the following websites to help you complete your task!
weather data:
https://weather.com/weather/tenday/l/22807:4:US
make a graph:
http://nces.ed.gov/nceskids/createagraph/
Happy Graphing!
Process
Let's Get Graphing!
Follow these steps to make your line graph:
1) Pick a place to observe the weather
2) Click here: https://weather.com/weather/tenday/l/22807:4:US and enter the city in the search bar.
3) Click on 10 day forecast
4) On a sheet of paper, make a data table with the daily temperature
5) Cick here: http://nces.ed.gov/nceskids/createagraph/ to begin graphing your data
6) Click on line graph
7) Click on the data tab and enter in your data! (Make sure you have the 5 things a graph needs!)
8) Send your completed graph to my email :)
WooHoo! You just created a line graph!
Evaluation
| Unsatisfactory | Satisfactory | Excellent | |
| Labels on x-axis and y-asix | The x and y axis do not have labels | The x and y axis have labels, but they are labeled incorrectly. | The x and y axis are labeled correclty. |
| Title on graph | There is not title on the graph. | The title on the graph does not correspond to the data represented. | The title on the graph matches the data on the graph. |
| Scale with matching interval | There is no scale on the graph. | There is a scale, but there are no intervals. | There is a scale with matching intervals. |
| Accurate data | The data on the graph does not match the data on the website. | Some of the data on the graph matches the data on the website. Some of the data on the graph does not match the data on the website. | All of the data on the graph matches the data on the website. |
| Graph shows change over time | The graph does not show change over time. | The graph shows change, but not change over time. | The graph shows change over time. |
Conclusion
Always remember, line graphs show change over time! Examples include change in weather, distance traveled, and many more!