Introduction

Welcome students! You are about to learn about graphs! We will be learning about a bar graph. Bar graphs are used to collect data and present it in a clear way that everyone can understand!
Task

Today at lunch, our options were as follows:
- Grilled Chicken Club Wrap w/ Applesauce
- Chicken Nuggets w/ Fries
- Pizza
- Turkey in Gravy w/ Dressing
I would like you to create a bar graph, like we learned in class, to show how many people ate each menu item. After this, answer the questions in the conclusion section.
Today,
4 people had the Grilled Chicken Club Wrap w/ Applesauce.
9 people had Chicken Nuggets w/ Fries
5 people had Pizza
2 people had Turkey in Gravy w/ Dressing
With this information, create a bar graph using the website I will provide.
Process
Step One: Watch the video on bar graphs and take the quiz here.
Step Two: Do the interactive activity on interpreting data here.
Step Three: Pull up the website to build a bar graph here.
Step Four: Enter in the date from the Task slide to complete the bar graph.
Step Five: Email the link to your bar graph to me or print it out, and answer the questions on a seperate sheet of paper and we will go over them in class!
Remember:
Your bar graph must have a title, x-axis label, y-axis label, categories, scale, and bars showing your data. If you have forgotten what a bar graph looks like, watch the videos again.
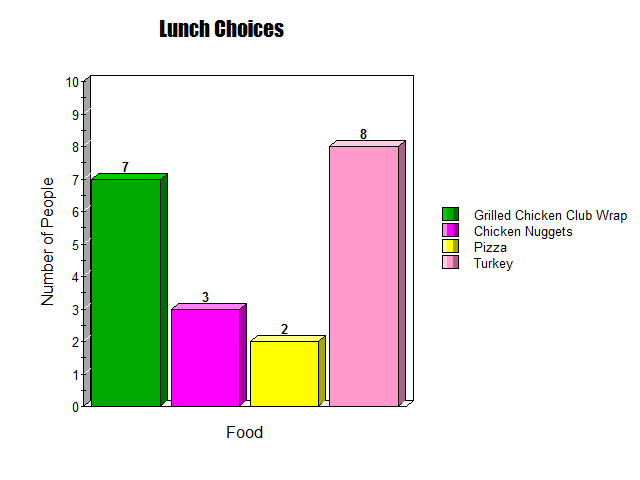
Your graph should end up looking something like this:
****Note: My data is NOT correct, this only serves as an example*****
***You may click on the picture below and it will redirect you to another website to create a bar graph****
Evaluation
Bar Graph Rubric
| UnSatisfactory (0) | Satisfactory (3) | Exemplary (5) | |
| Videos/Quizzes | Student does not watch the video or do the quiz. | Student only completed one of these tasks. | Student watched all videos and completed all quizzes. |
| Bar Graph | Student did not create a bar graph. | Student created a bar graph, some or all of the information is wrong or axis' are not labeled. | Student successfully completed the bar graph. |
Total: ____ out of 10 points.
Conclusion
You have successfully created a bar graph! You practiced by playing fun games and proved you knew what you were doing by taking quizzes. As you go through school, you will be asked again to make graphs so make sure you remember what you learned through this webquest. Great work! Now answer these questions:
1. How do you collect data?
2. What other types of graphs are there besides bar graph?
3. Besides lunch choices, what else could you create a graph for?
4. Does your graph need a title?
5. Would you still put Chickenn Club on the graph if no one had chosen it?
6. If a collection of information has 26 as the highest number, what would you make the maximum?
7. What do you call the information that is vertical on the graph?
8. What do you call the information that is horizontal on the graph?
9. Why do you think more people chose chicken nuggets over turkey?
10. What did you choose for lunch?
Credits

StudyJams Bar Graph Activity:
http://studyjams.scholastic.com/studyjams/jams/math/data-analysis/bar-g…
Top Marks Interpreting Data Activity:
http://www.topmarks.co.uk/Flash.aspx?b=maths/interpretingdata
Create A Graph:
https://nces.ed.gov/nceskids/graphing/classic/bar.asp
http://www.mathsisfun.com/data/bar-graph.html
Standard:
3.MDA.3 Collect, organize, classify, and interpret data with multiple categories and draw a scaled picture graph and a scaled bar graph to represent the data.