Introduction
It shows me that you are able to follow directions!
As you are aware (or you wouldn't be here) you have been chosen to complete a mission of self - discovery. What you don't know is that you have a secret mission as well.
Your class needs a Mascot!
I am counting on you to provide it. This mascot will represent your class in more ways then one. It will show the greater traits your class has as a whole.
I think its time for me to introduce myself. Follow this link to find me.
http://www.voki.com/php/viewmessage/?chsm=fad9fc7745f057fa793f3cb5a0e0c709&mId=2701583
The chances of you coming out the way you did are very slim. It was all a down to chance really. No one could predict how you would turn out. To give you some examples here are a few games of chance for you to try your
POWERS OF PREDICTION.
Click on the red hair and blue eye options only:
http://gel.msu.edu/DNAroulette/
Now try this one!
http://genome.pfizer.com/machine.cfm
Wow!! Hard to predict isn't it? Well... maybe this video will help you to make a bit more sense of it all.
http://learn.genetics.utah.edu/content/inheritance/traits/
I hope you trully warmed up your POWERS OF PREDICTION you will be doing some more predicting shortly!
Your mission today is to collect the information submitted by your class regarding traits that they individually hold and compiling all of that information into a given online graph. You will also interpret this data by being able to answer questions regarding it. Be prepared to be able to define some new words and concepts at the end of this mission as well. Grab a mirror so you can study your uniqueness and get ready to learn about you!

Task
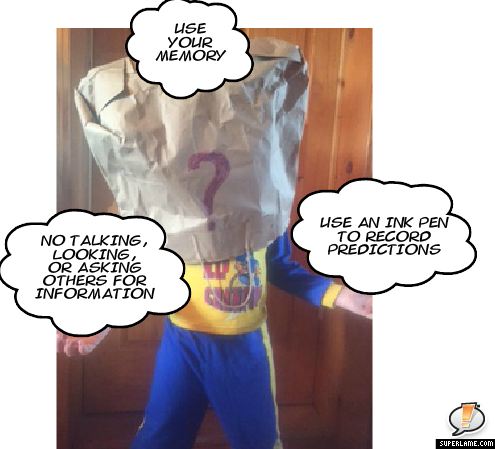
Today you will be completing several tests. Ohh... worried now? Don't be... the test today has no wrong answers, take no preparation, and only require two things. You and a mirror.
You will be testing to see if you have the some of the traits you have are dominant or recessive. The next link will show you some of the traits we will be recording data about. Have a look through the link, I think you will find you are able to handle this kind of test!
http://learn.genetics.utah.edu/content/inheritance/observable/
Simple really isnt it?
Hold on before you go any further.... time to test your POWER OF PREDICTION! Grab a data table from the front of the room and do your best to make your predictions under the correct column.
After you have made your predictions, turn the sheet over and set it aside. You will return to it later.
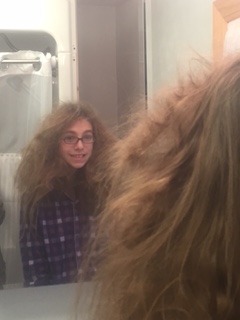
Now, are you ready collect your data? Oh, and don't worry if your hair looks ok, this isn't about that!
Work through this sheet:
https://docs.google.com/forms/d/1aQg0X_kN7YRwX6R2D_Ebb6N1QRzOR3MxvrPcpuwLl5g/edit#
and record your data online and on your data sheet.
Oh, and you have forgotten what you are looking for don't be afraid to jump back a bit to review. You can look at the site as often as you need to for examples.
Process
Now would be an excellent time for you to work on some of the words you have learned today. You will need to be sure to enter these words into your Science Vocabulary Dictionary.
Please find and record the definitions for TRAIT, RECESSIVE and DOMINANT as you read through the following passage:
Check back to see that all of your classmates have entered their data. You should see information for the number of students that your teacher has written on the board for you. If you find that not all students have entered their data, why not go back to the games of chance for a while and keep practicing your POWERS OF PREDICTION.
Just remember after a couple of rounds to come back and check on the data. Once all information is gathered, your teacher will cue you, but you may be able to get a bit of a head start!
Take the information that they submitted add it to your data table.
What Time Is It? It's Time to Graph!!!
What Time Is It? It's Time to Graph!!!
Create a Bar Graph at: http://nces.ed.gov/nceskids/createagraph/default.aspx
1. Chart the DOMINANT and RECESSIVE genes that are in your class for each classifications.
2. Print your graph.
Create a Line Graph at:
http://nces.ed.gov/nceskids/createagraph/default.aspx
1. Chart 2 lines. One line should show your predictions. The next line should show the number of classmates that carry the DOMINANT traits for each catagory.
2. Print your chart.
NOW IT IS TIME FOR YOUR SECRET MISSION: THE CLASS MASCOT
1. Create a Three Dimensional Mascot for our class.
The Mascot should meet the following criteria:
A. It must be Three Dimensional.
B. It must include the traits held by the majority of our class. The traits must be
easy to identify.
C. It must be able to live in the shoe box provided by your teacher.
D. You may use any of the materials provided to construct your mascot.
Please turn your Science Vocabulary Dictionary, your bar graph and line graph into your teacher.
Evaluation
| Rubric Made Using: | |||||
| RubiStar ( http://rubistar.4teachers.org ) | |||||
| Making A Mask : Mascot | |||||
| Teacher Name: Mrs. Louca | |||||
| Student Name: ________________________________________ | |||||
| CATEGORY | 4 | 3 | 2 | 1 | 0 |
| Attractiveness/Craftmanship | The mascot shows that the creator was took great pride in his/her work. The design and construction look carefully planned. The item is neat (free of unwanted bumps, drips, marks, and tears). | The mascot shows that the creator took pride in his/her work. The design and construction look planned. The item has a few flaws (unwanted bumps, drips, marks, tears), but these do not detract from the overall look. | The design and construction were planned. The item has several flaws (unwanted bumps, drips, marks, tears), that detract from the overall look. | The mascot looks thrown together at the last minute. It appears that little design or planning was done. Craftmanship is poor. | |
| Details | All 10 Traits are clearly distinguishable and correlate to the data. | 7 - 9 traits are clearly distinguishable and correlate to the data | 4-6 traits are clearly distinguishable and correlate to the data. | 0-3 traits are clearly distinguishable and correlate to data. | There is no correlation between data and the traits of the mascot. |
| Durability | The mascot was built to last through multiple performances. | Most of the mascot is sturdy, but there are a couple of pieces that might need extra care when it is representing the class. | The basic structure of the mascot is sturdy, but many of the details are fragile. It looks like it would not look good after it represented the class once or twice. | The mascot is flimsy and falls apart easily. It may not last for one representation of the class. | |
| - Please Choose - | undefined | undefined | undefined | undefined | undefined |
| Date Created: November 06, 2015 |
|
|
||||
| Rubric Made Using: | ||||
| RubiStar ( http://rubistar.4teachers.org ) | ||||
| Graphing : What are the chances | ||||
| Teacher Name: Mrs. Louca | ||||
| Student Name: ________________________________________ | ||||
| CATEGORY | 4 | 3 | 2 | 1 |
| Labeling of X axis | The X axis has a clear, neat label that describes the units used for the independent variable (e.g, days, months, participants' names). | The X axis has a clear label that describes the units used for the independent variable. | The X axis has a label. | The X axis is not labeled. |
| Labeling of Y axis | The Y axis has a clear, neat label that describes the units and the dependent variable (e.g, % of dogfood eaten; degree of satisfaction). | The Y axis has a clear label that describes the units and the dependent variable (e.g, % of dogfood eaten; degree of satisfaction). | The Y axis has a label. | The Y axis is not labeled. |
| Title | Title is creative and clearly relates to the problem being graphed (includes dependent and independent variable). It is printed at the top of the graph. | Title clearly relates to the problem being graphed (includes dependent and independent variable) and is printed at the top of the graph. | A title is present at the top of the graph. | A title is not present. |
| Data Table | Data in the table is well organized, accurate, and easy to read. | Data in the table is organized, accurate, and easy to read. | Data in the table is accurate and easy to read. | Data in the table is not accurate and/or cannot be read. |
| Neatness and Attractiveness | Exceptionally well designed, neat, and attractive. Colors that go well together are used to make the graph more readable. | Neat and relatively attractive. A ruler and graph paper (or graphing computer program) are used to make the graph more readable. | The graph appears quite plain. Colors chosen are very similar and it is difficult to read the data. | |
| Vocabulary Dictionary | All Three words are entered in the dictionary. The definitions are written legibly and are accurate. Hand drawn pictures are included in the entry. | All Three words are entered in the dictionary. The definitions are written legibly and are accurate. Hand drawn pictures are not present for all three entries. | All Three words are entered in the dictionary. The definitions are written. Hand drawn pictures are not included in the entry. | Missing one or all of the vocabulary words. Definitions are inaccurate or one or more are missing. |
| Date Created: October 25, 2015 | ||||
Conclusion
AHA! I see that you have completed your mission. I hope that you were able to make some good discoveries about yourself.
The graphs you created show me how well you were able to interpret the data that your classmates submitted.
How well do you think you predicted the traits of your classmates?
Don't forget traits are complicated!
Now, pick up that mirror again. Have a good look at yourself. You are unique. No one is quite like you.
Now look around at your classmates. Each of them is pretty different aren't they? However, the data you worked with today to build your graphs show you that many of you share the same exact traits.
I hope that you were able to get good definitions for traits, recessive and dominant. These words will help you over the upcoming lessons in which you will further explore what makes you you.
OHHHHHH..... Fix your hair will you? It's been driving me crazy!
Later,
Chromo
Credits
Standards:
M4.E.1.1.1: Describe, interpret and/or answer questions based on data shown in tables, charts, bar graphs or pictographs.
S4.B.1.1.2: Compare similar functions of external characteristics of organisms (e.g., anatomical characteristics: appendages, type of covering, body segments).
S4.B.2.2.1: Identify physical characteristics (e.g., height, hair color, eye color, attached earlobes, ability to roll tongue) that appear in both parents and could be passed on to offspring.
Credits:
-
Create A Graph. (n.d.). Retrieved October 26, 2015, from
-
DNA Roulette. (n.d.). Retrieved October 26, 2015, from
-
Heredity Slots - The Gene Machine. (n.d.). Retrieved October 26, 2015, from
-
Observable Human Characteristics. (n.d.). Retrieved October 26, 2015, from
http://learn.genetics.utah.edu/content/inheritance/observable/
-
Rubistar Create Rubrics for your Project-Based Learning Activities. (n.d.). Retrieved October 26, 2015, from
-
Santos II, D. (n.d.). 5 Sec Faces: A Collective Portrait | Danny Santos II - Professional Photographer in Singapore. Retrieved November 1, 2015, from
-
Standards - View Standards by Subject Area and Grade Level or Course. (n.d.). Retrieved October 26, 2015, from
http://www.pdesas.org/Standard/Views#109|792|0|0
-
SuperLame! Comic Word Balloons, Speech Bubbles, and Thought Balloons, etc. (n.d.). Retrieved November 7, 2015, from
-
Take Inventory of Your Genetic Traits. (n.d.). Retrieved October 26, 2015, from
-
View Message. (n.d.). Retrieved November 7, 2015, from
http://www.voki.com/php/viewmessage/?chsm=fad9fc7745f057fa793f3cb5a0e0c709&mId=2701583
-
What is a Trait? (n.d.). Retrieved October 26, 2015, from