Introduction
Students, your teacher needs your help! She is planning vacations to specific destinations and needs to know what the weather is like throughout the year so she knows what to pack. There are six desitinations that she has in mind:
1. Miami, Florida
2. New York City, New York
3. Seattle, Washington
4. Phoenix, Arizona
5. Chicago, Illinois
6. Juneau, Alaska
She needs your help gathering data about each season (e.g. average temperature, precipitation, humidity, wind direction).
Task

You will be divided into groups of 4. Each group will gather data for a different travel destination and create a seasonal weather forecast presentation to show your class and your teacher.
Your group will also create a table showing the average weather conditions for each season of the year. You will need to find the averages for data you collect for each of the 3 months, so lets rev up our math skills!
Process
Step 1: You will be placed into groups of four. Each person will focus on one specific location.
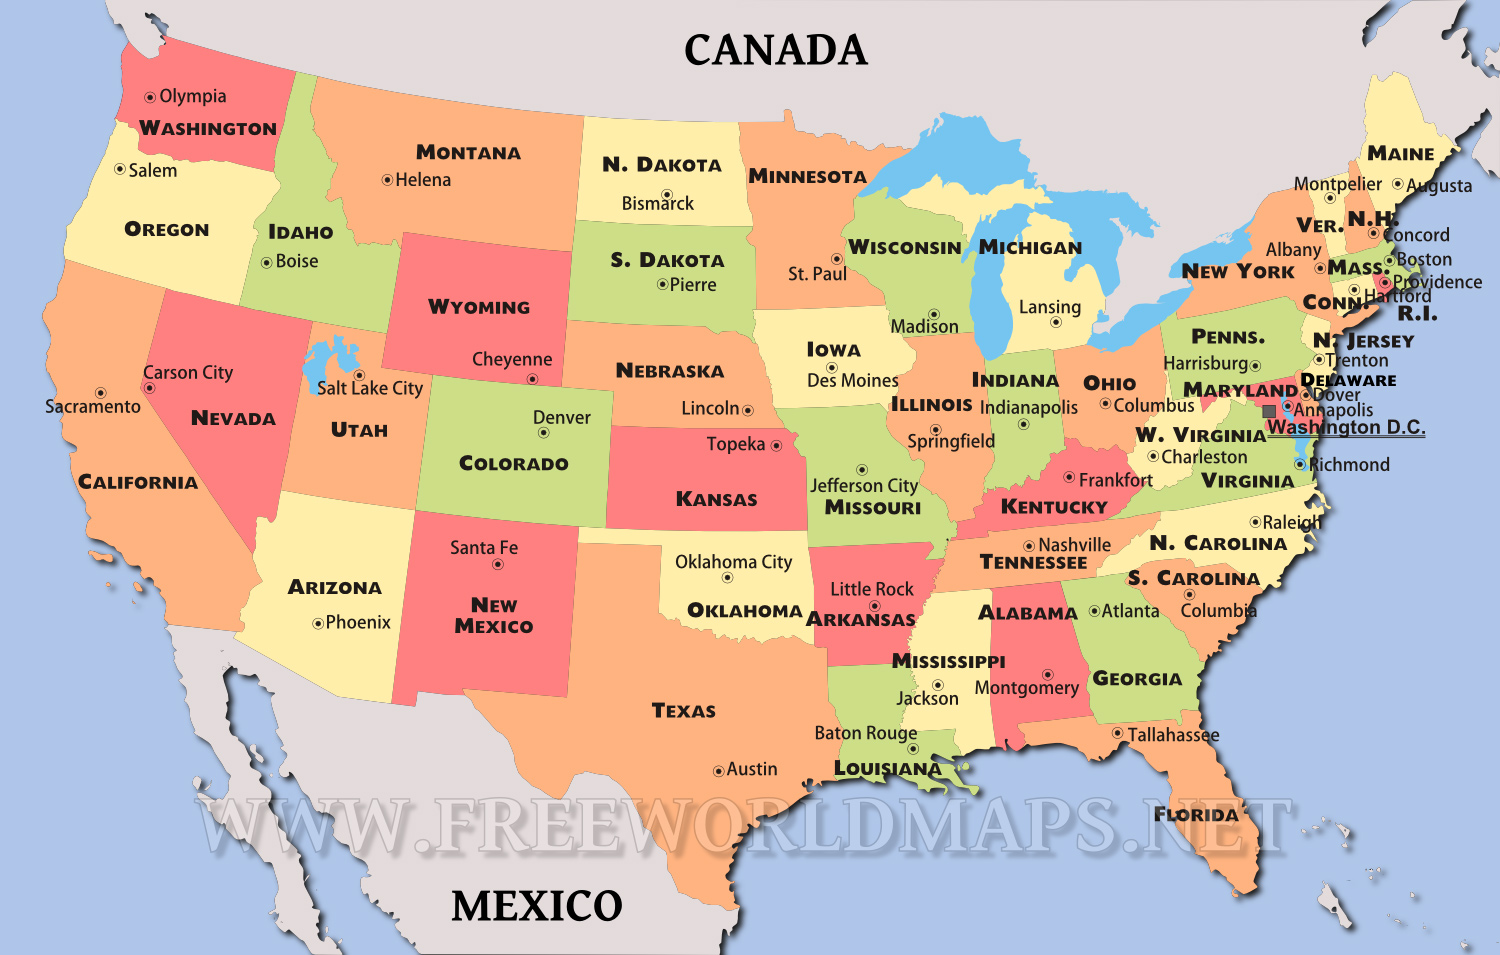
Each group must be aware of where their state is located on the map below.
Step 2: Using the link below, you will aslo define the following weather terms in your journal:
- temperature
- precipiation
- humidity
- wind
http://www.weatherwizkids.com/weather-words.htm
Step 3: Use the following links to find the monthly average for the location you were given. Locate the section where a summary of the monthly forecast is provided. You will have to look up data for each month individually in the prior year. (Future weather forecasts are not available that far ahead). Then record the averages for your 3 months in your journal.
- spring - starting March 1 and ending May 31,
- summer - starting June 1 and ending August 31,
- fall (autumn) - starting September 1 and ending November 30, and
- winter - starting December 1 and ending February 28
Chicago, Illinois
http://www.wunderground.com/history/airport/KMDW/2015/1/26/MonthlyHistory.html
Juneau Alaska
http://www.wunderground.com/history/airport/PAJN/2015/1/25/MonthlyHistory.html
Miami, Florida
New York City, New York
http://www.wunderground.com/history/airport/KNYC/2015/1/26/MonthlyHistory.html
Phoenix, Arizona
http://www.wunderground.com/history/airport/KPHX/2015/1/25/MonthlyHistory.html
Seattle, Washington
http://www.wunderground.com/history/airport/KBFI/2015/1/25/MonthlyHistory.html
Step 4: Now you will need to use your excellent math skills! You will need to find the averages of the data you recorded for your 3 months to get the seasonal average! Here is the formula to help you remember how to find the average
Month 1 + Month 2 + Month 3
3
Step 5: Once you have gathered all of the averages for your season, use your poster board to create a table as a group. Compare your averages for the season you chose. Are some seasons similar? Or are they very different? Your table should look like this:
| Winter | Spring | Summer | Fall | |
| Temperature | ||||
| Precipitation | ||||
| Humidity | ||||
| WInd |
Feel free to add pictures of the destination you were given. Make your presentation creative!
Evaluation
You will be graded on the following:
Journal Content 10 points
Calculations of Averages 5 Points
Poster Board 10 Points
Participation during Presentation 5 Points
Grading Rubric
| 1- Far Below Expections | 2 - Below Expectations | 3 - Meets Expectations | 4 - Exceeds Expecations | |
|
Journal Content |
No data has been recorded. | Has record some data but is missing a lot of work. | Has recorded all data (vocabulary terms, month averages, calculations, seasonal averages. | Student recorded additional vocabulary terms and other relevant information |
| Calculations | Seasonal averages are not found | Student found 2 out of 4 seasonal averages. | Student correctly solved at least 3 out of 4 seasonal averages. Work is shown. | Student is able to correctly solve all seasonal averages. Work is shown |
|
Poster Board (as a group) |
Only 1 seasonal average is included | Only 2 seasons are provided | Only 3 seasons are provided. | Weather forecast averages for all seasons are included. |
| Participation | Student does not participate. | Student at least half of the averages found for their season. | Student explains the averages found for their season. | Student explains the averages found for their season and provides an interesting fact about the destination. |
Conclusion

Thank you for all your help! Now I am confident that I will pack the necessary items when I travel to any of these destinations. Your presentations also helped each other! If any of you travel to any of these destinations, you will know what to pack as well!
Great Job class!
Teacher Page
Science Standard
3-ESS2-1. Represent data in tables and graphical displays to describe typical weather conditions expected during a
particular season.