Introduction
This webquest will take you on a journey to look at what you may choose to eat at fast food
and sit-down restaurants. You are initially going to go to a website that will give you access to
the nutrition information of the menu items of fast food/sit down restaurants. You are going
to plan a meal and get the nutrition information for 4 different meals, which will each include
a main dish, a side, a drink, and dessert. You must use meals from at least 2 different
restaurants, since you will be doing some comparisons of the two restaurants.
You will record the information that you have found using Excel, and you will create charts to
look at your data and make comparisons in Excel using charts. You will then visit the USDA’s
food and nutrition site to research information about daily nutrition recommendations for
children your age, and chart the information you found in Excel.
Once you have gathered all your information, you will then summarize your findings, and
make some conclusions about your nutritional findings in a Word document. You will then
create a PowerPoint to give a visual presentation of your findings.
Task
Tasks
Task I: Collect and Enter Data Procedure:
- For this task you will visit the restaurant website to obtain the nutritional information for 4 meals from at least 2 different restaurants.
- For each meal, you should include a main dish, a side dish, a drink, and a dessert.
- You will record the needed information in an Excel spread sheet in the format provided, including some calculated columns.
Task II: Creating Charts:
- For this task you will create a number of charts to add a visual representation to your data.
- You will select two meals for which you will create a total of 4 charts that will compare the nutritional value of the two meals, individually and in direct comparison.
Task III: Obtaining USDA food and nutritional information
- For this task you will visit the USDA’s food and nutrition site to obtain information about healthy eating.
- You will use the information on this site to create another Excel worksheet for use in making your conclusions.
- You will also ‘play’ with the SuperTracker to look at recommendations for a child of the same age and gender.
Task IV: Write a short report on your findings:
- You will use a properly formatted MS Word document to write a short report of your findings.
- Your report will include in introductory paragraph. The second paragraph should talk about the meals you selected. And the third paragraph should be a conclusion about your findings.
- You will also include a chart from your Excel spreadsheet as a visual representation.
Task V: Create a PowerPoint to showcase your findings
- You will use PowerPoint to create a presentation to give a visual representation of your findings.
Process
Normal
0
false
false
false
EN-US
X-NONE
X-NONE
/* Style Definitions */
table.MsoNormalTable
{mso-style-name:"Table Normal";
mso-tstyle-rowband-size:0;
mso-tstyle-colband-size:0;
mso-style-noshow:yes;
mso-style-priority:99;
mso-style-parent:"";
mso-padding-alt:0in 5.4pt 0in 5.4pt;
mso-para-margin-top:0in;
mso-para-margin-right:0in;
mso-para-margin-bottom:10.0pt;
mso-para-margin-left:0in;
line-height:115%;
mso-pagination:widow-orphan;
font-size:11.0pt;
font-family:"Calibri","sans-serif";
mso-ascii-font-family:Calibri;
mso-ascii-theme-font:minor-latin;
mso-hansi-font-family:Calibri;
mso-hansi-theme-font:minor-latin;}
Process
Process - Task I: Collect and Enter Data Procedure:
1. Visit the following website: http://www.dietfacts.com/fastfood.asp The link to this site can be found on the agenda or in the links section on the class page.
2. You are going to pick 4 different restaurants. At each restaurant, you will plan a meal. Each meal should include a main dish (sandwich, salad, etc), a side dish (French fries, salad, etc.), a drink, and a dessert.
3. For each of the restaurants you picked, record the following information, using the attached data collection sheets: Serving size, Calories, Total fat (g), Saturated fat (g), Trans fat (g), Total Carbohydrates (g), Dietary Fiber (g)
4. Pick a variety of main dishes. You will be comparing two of the meals, so they can either be similar meals or totally different. For example: If your first restaurant was McDonald’s and you selected the Angus Mushroom Swiss Burger, you could find a Burger sandwich that is similar, or you could select a Chicken sandwich.
5. Once you have all your data collected, create an excel spreadsheet to record your data. See the example of the worksheet on the second page to see what you should put in the worksheet.
Normal
0
false
false
false
EN-US
X-NONE
X-NONE
/* Style Definitions */
table.MsoNormalTable
{mso-style-name:"Table Normal";
mso-tstyle-rowband-size:0;
mso-tstyle-colband-size:0;
mso-style-noshow:yes;
mso-style-priority:99;
mso-style-parent:"";
mso-padding-alt:0in 5.4pt 0in 5.4pt;
mso-para-margin-top:0in;
mso-para-margin-right:0in;
mso-para-margin-bottom:10.0pt;
mso-para-margin-left:0in;
line-height:115%;
mso-pagination:widow-orphan;
font-size:11.0pt;
font-family:"Calibri","sans-serif";
mso-ascii-font-family:Calibri;
mso-ascii-theme-font:minor-latin;
mso-hansi-font-family:Calibri;
mso-hansi-theme-font:minor-latin;}
a. First set up the spreadsheet with the appropriate headings, and put in the specified columns.
colA: Restaurant colB: Menu Item colC: Serving Size
colD: Total Calories colE: Total Fat (g) colF: Calories from Fat
colG: Saturated Fat colH: Trans Fat (g) colI: Total Carbs (g)
colJ: Calories from Carbs colK: Dietary fiber (g)
colL. % Calories from Fat colM:. % Calories from Carbs
b. Now that you have the spreadsheet set up, you can begin by entering the data. There are FOUR columns that you must enter formulas to calculate the value. For now you should leave those columns blank. We will enter the formulas after you have entered your data for the restaurants that you collected. The four columns are: f. Calories from Fat, j: Calories from Carbs, l: Percentage of Calories from Fat, and m: Percentage of Calories from Carbs.
c. Begin entering the data. You can reset the way the cursor moves when you press the enter key. This will change the cursor to move from right to left, rather than up and down. To change the cursor do the following: Click on the Windows icon, then click on Excel options. Now click on Advanced. Under the editing options, it says After pressing Enter, move selection Direction [Down]. The default is Down, you may change it to Right. This will move the cursor to the right when you press Enter.
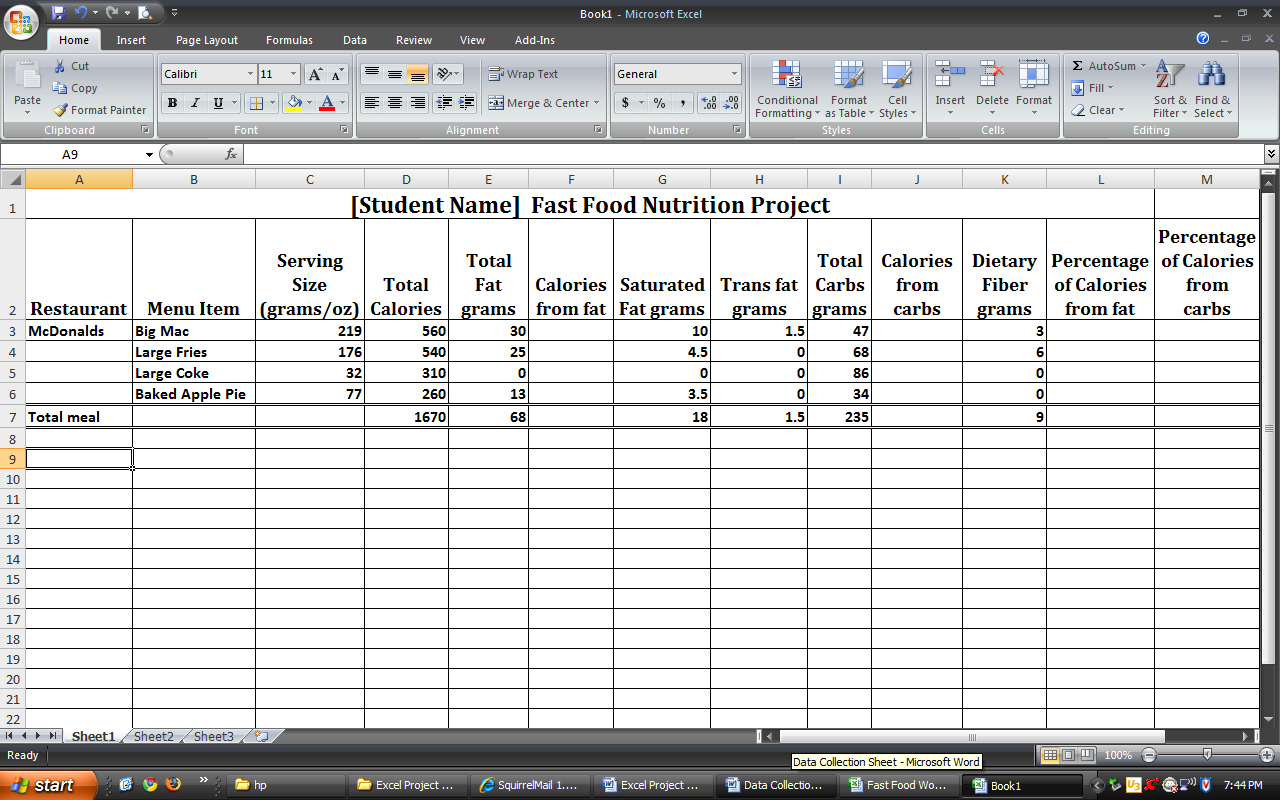
d. Enter the data as shown in the screen print below. Be sure to leave the 4 columns blank that need formulas. Once the data is entered, put in a total row that will total the columns (hint: Use AutoSum).
Normal
0
false
false
false
EN-US
X-NONE
X-NONE
/* Style Definitions */
table.MsoNormalTable
{mso-style-name:"Table Normal";
mso-tstyle-rowband-size:0;
mso-tstyle-colband-size:0;
mso-style-noshow:yes;
mso-style-priority:99;
mso-style-parent:"";
mso-padding-alt:0in 5.4pt 0in 5.4pt;
mso-para-margin-top:0in;
mso-para-margin-right:0in;
mso-para-margin-bottom:10.0pt;
mso-para-margin-left:0in;
line-height:115%;
mso-pagination:widow-orphan;
font-size:11.0pt;
font-family:"Calibri","sans-serif";
mso-ascii-font-family:Calibri;
mso-ascii-theme-font:minor-latin;
mso-hansi-font-family:Calibri;
mso-hansi-theme-font:minor-latin;}
e. Once you finish entering all the data you collected, and put in the total meal rows, you can now put in the formulas to calculate the four columns that you left empty. The four columns are calculated as noted below. You are going to enter just the first one, then you can just copy/paste the data down the column.
a. Calories from fat. There are 9 calories for every 1 gram of fat. As you can see in the above example: the Big Mac has 30 fat grams, so the Calories from Fat would be 30 * 9 = 270. Be sure that you enter a formula that references the correct cell. (hint: =e3*9)
b. Calories from carbohydrates. There are 4 calories for every 1 gram of carbohydrate. As you can see in the above example: the Big Mac has 47 carb grams, so the Calories from Carbs would be 47 * 4 = 188. Be sure that you enter a formula that references the correct cell. (hint: =i3*4)
c. Percentage of calories from fat. To calculate this percentage, you use the following formula: Calories from fat / Total Calories (hint: =f3/d3)
d. Percentage of calories from carbs. To calculate this percentage, you use the following formula: Calories from carbs / Total Calories (hint: =j3/d3)
f. Once you have entered the four formulas in the first row, you may now copy/paste the formula all the way down the column, or you may use the fill handle. Note how it puts in the correct reference.
g. See the picture below of what your worksheet should basically look like. You may use the font and sizing that you like. Make sure you have put in formulas, and not just typed in the amounts. You MUST turn in the actual saved workbook.

Normal
0
false
false
false
EN-US
X-NONE
X-NONE
/* Style Definitions */
table.MsoNormalTable
{mso-style-name:"Table Normal";
mso-tstyle-rowband-size:0;
mso-tstyle-colband-size:0;
mso-style-noshow:yes;
mso-style-priority:99;
mso-style-parent:"";
mso-padding-alt:0in 5.4pt 0in 5.4pt;
mso-para-margin-top:0in;
mso-para-margin-right:0in;
mso-para-margin-bottom:10.0pt;
mso-para-margin-left:0in;
line-height:115%;
mso-pagination:widow-orphan;
font-size:11.0pt;
font-family:"Calibri","sans-serif";
mso-ascii-font-family:Calibri;
mso-ascii-theme-font:minor-latin;
mso-hansi-font-family:Calibri;
mso-hansi-theme-font:minor-latin;}
Process - Task II: Creating charts
Summary: You will now be creating a number of charts to add a visual representation to your data. You will select two meals for which you will create charts. You should have a total of 4(four) charts. You will put the charts on the second worksheet in the workbook.
Procedure:
1. You will create the charts on the second worksheet (Sheet 2). Be sure to change the name of the tab and color of the tab (see rubric).
2. Merge two cells in the top row. Type in Charts. Format it so that it is whatever font you want, but make it bold, and make it stand out with a larger size.
3. You are going to create charts for the two meals that you chose.
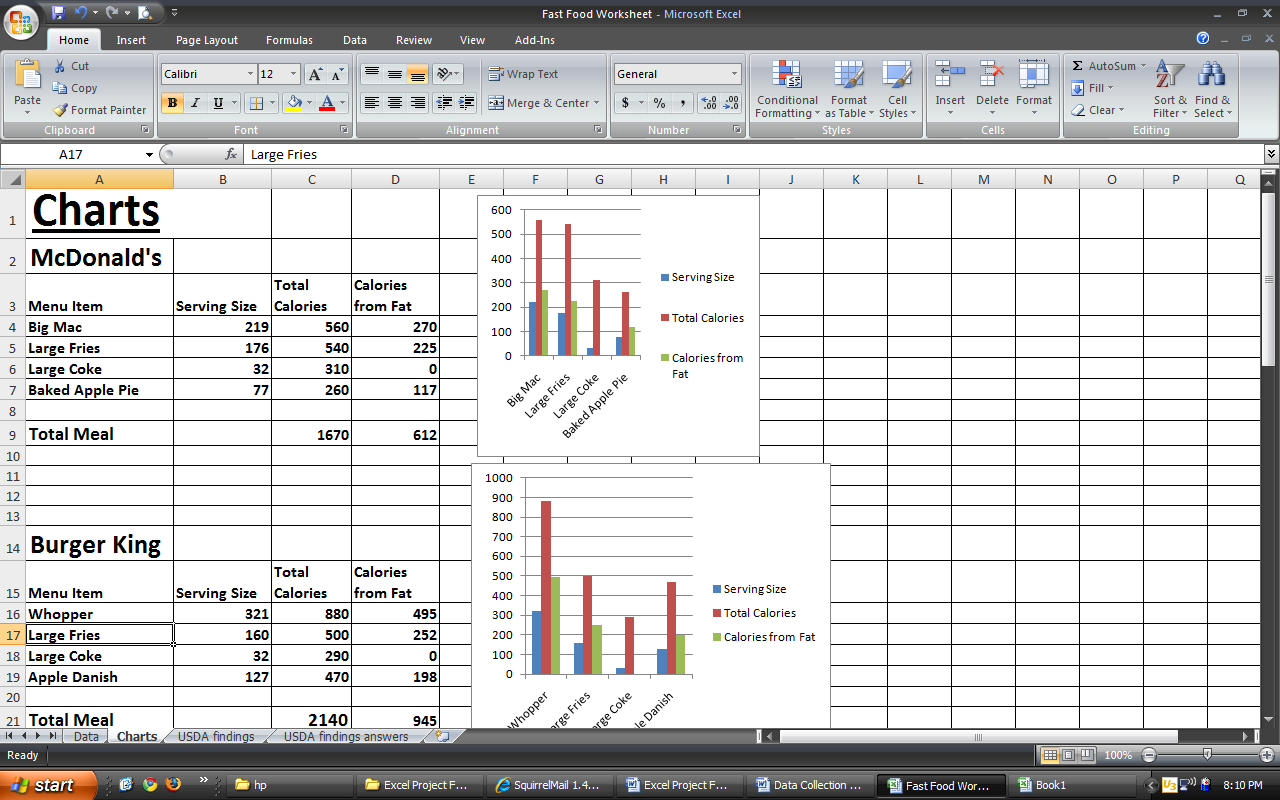
4. Put in the Restaurant Name, the Menu Item, Serving Size, Total Calories and Calories from Fat for each of the menu items for the restaurants that you picked. (see example below, I chose to use a 2D Clustered Column chart)
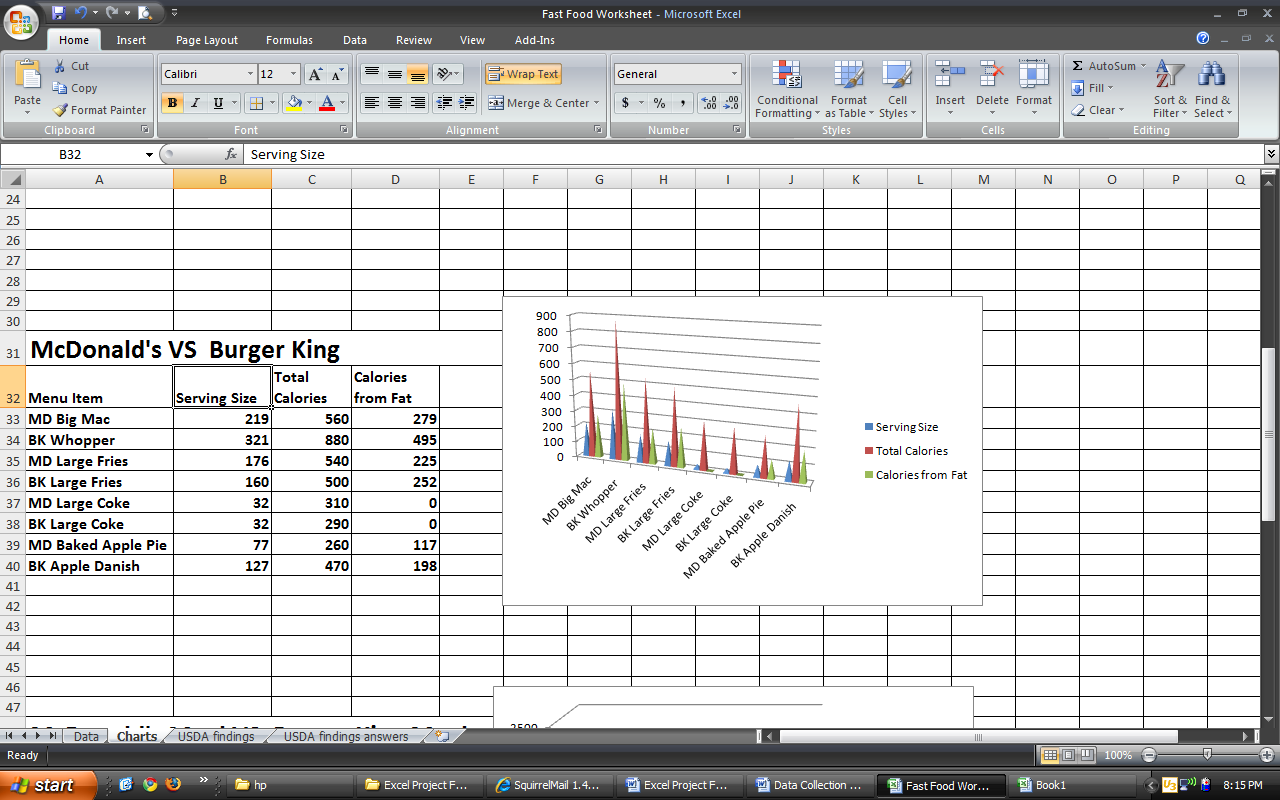
5. Now you are going to put the two restaurants together to see how they stack up against each other. You are going to take the information from the two main dishes and put them together. Look at the example below, and notice how the two sandwiches are together, the sides (fries) are together, the drinks, and the desserts are together. (See example below. I chose to use a Clustered Pyramid chart)
 f
f
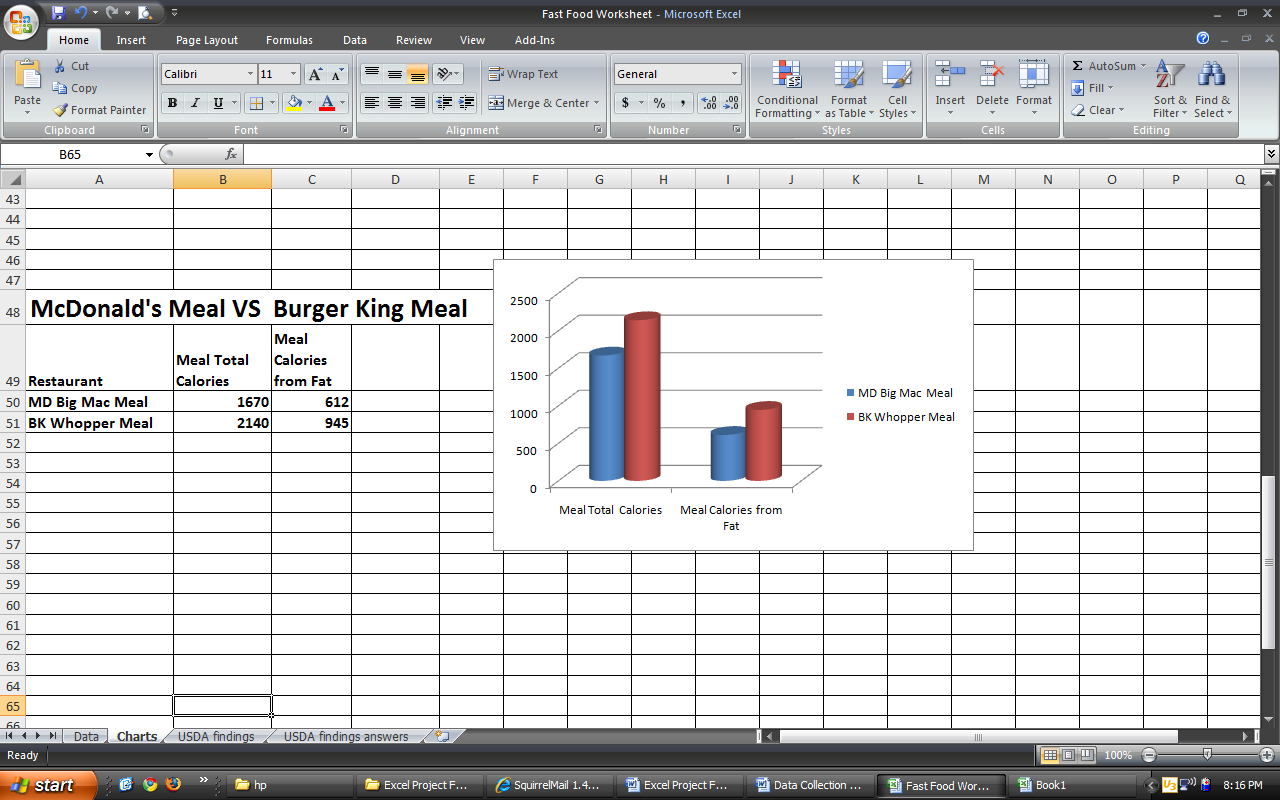
6. Now you will put the two restaurant meals in a chart to look at them side by side for the total meal. (See example below. I chose to use a Clustered Cylinder chart)
Normal
0
false
false
false
EN-US
X-NONE
X-NONE
/* Style Definitions */
table.MsoNormalTable
{mso-style-name:"Table Normal";
mso-tstyle-rowband-size:0;
mso-tstyle-colband-size:0;
mso-style-noshow:yes;
mso-style-priority:99;
mso-style-parent:"";
mso-padding-alt:0in 5.4pt 0in 5.4pt;
mso-para-margin-top:0in;
mso-para-margin-right:0in;
mso-para-margin-bottom:10.0pt;
mso-para-margin-left:0in;
line-height:115%;
mso-pagination:widow-orphan;
font-size:11.0pt;
font-family:"Calibri","sans-serif";
mso-ascii-font-family:Calibri;
mso-ascii-theme-font:minor-latin;
mso-hansi-font-family:Calibri;
mso-hansi-theme-font:minor-latin;}
Process - Task III: Visit the USDA Website for information
1. Visit the USDA’s new and improved website for food and nutrition information: www.choosemyplate.gov This website has information for healthy eating.
2. On the home page, you will see a green bar with numerous links. First you will look at the different food groups to gather information about them. Click on the link for MyPlate in the top left. This will display the food groups main page.
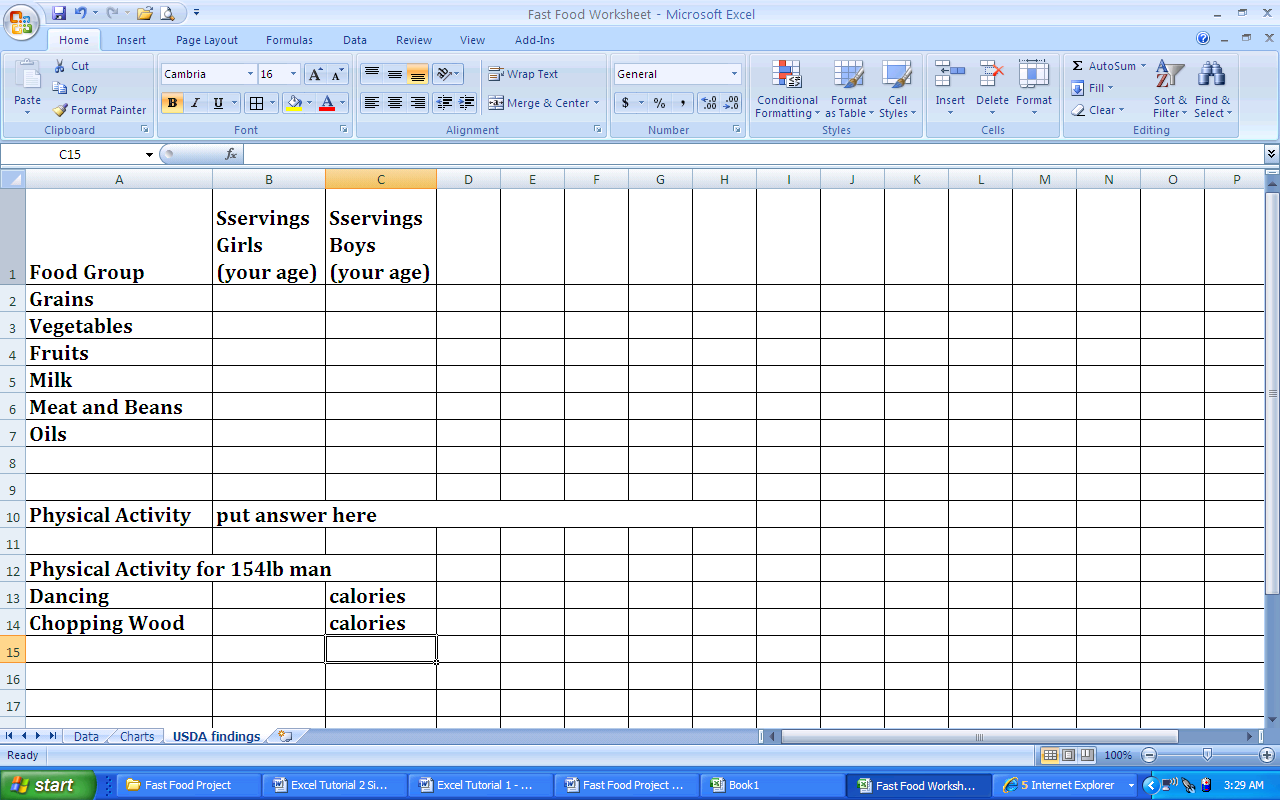
3. Use the links on this page to find out how many servings of each category from the food pyramid is recommended for someone your age. Look below to see what the Excel worksheet should look like.
a. Fruits (click on Fruits, then click on How much is needed, click on the link to see the chart)
b. Vegetables (click on Vegetables, click on How much is needed, click on the link to see the chart)
c. Grains (click on Grains, click on How much is needed, click on the link to see the chart)
d. Protein Foods (NOTE: this was previously called Meats and Beans) (click on Protein Foods, click on How much is needed, click on the link to see the chart)
e. Dairy (click on Dairy, click on How much is needed, you will immediately see this chart)
f. Oils (click on Oils, click on What’s my allowance?, click on the link to see the chart)
4. How much physical activity is needed?
a. Click on the Physical Activity link, click on How much is needed. Read this page to find the answer.
5. Find out How many calories a 154lb man uses Dancing for 1 hour? Chopping wood for 1 hour?
a. Click on How many calories can I burn? Click to see the chart. (Hint: Chopping wood is heavy yard work, under vigorous physical activity)
6. Enter your information collected on a new worksheet (Sheet 3). Be sure to change the name of the tab and the color of the tab. See the example below for how to format the information on the worksheet.
7. Click on the SuperTracker and other Tools link. This will tell you how much of each food group you need daily when you enter the information about yourself. Click on the link for the SuperTracker. Find where it says Get Started>. Below you will click on the button that says Create your Profile. In Step 1, you will put in the information for yourself. Make up a profile name and put in your age, gender, physical activity, height and weight. Skip Step 2 for Registering, and go to Step 3 to submit your information. This will then display the recommendations for someone your age, gender, height and weight.
Normal
0
false
false
false
EN-US
X-NONE
X-NONE
/* Style Definitions */
table.MsoNormalTable
{mso-style-name:"Table Normal";
mso-tstyle-rowband-size:0;
mso-tstyle-colband-size:0;
mso-style-noshow:yes;
mso-style-priority:99;
mso-style-parent:"";
mso-padding-alt:0in 5.4pt 0in 5.4pt;
mso-para-margin-top:0in;
mso-para-margin-right:0in;
mso-para-margin-bottom:10.0pt;
mso-para-margin-left:0in;
line-height:115%;
mso-pagination:widow-orphan;
font-size:11.0pt;
font-family:"Calibri","sans-serif";
mso-ascii-font-family:Calibri;
mso-ascii-theme-font:minor-latin;
mso-hansi-font-family:Calibri;
mso-hansi-theme-font:minor-latin;}
Process - Task IV: Write a short report on your findings
1. You will use MS Word to write a short report of your findings.
2. You should format the document as follows:
a. Use Narrow margins
b. Put in 3 line heading (name/date/class period), right justified, single spaced, no space after, comic sans font, 11pt
c. Put in a title; bold, centered, underlined, Comic Sans font, 14pt
d. Body of essay, justify, comic sans font, 12pt, 1.5 spacing
3. You should have 3 paragraphs (3 -5 sentences).
4. The first paragraph will be an introductory paragraph. Talk about the first meal that you picked. Why did you pick the meal? Is it something that you like to eat, or was it just the first thing you found?
5. The second paragraph will talk about the two meals and the two restaurants that you chose to chart. How do the two restaurants compare? Were they close to the same in total calories and total fat?
6. Pick one of the charts to insert into your essay.
7. The third paragraph should be a conclusion about what you found. What do you think about the meals and restaurants that you picked? Do you go to these restaurants? After using the My Pyramid program to look at what you should be eating, do you think you eat healthy?
8. Make sure that you reread your report before turning it in to make sure it makes sense. Check for spelling, since you will be marked off for spelling. You will print the report. Also be sure to check for capitalization.
Process - Task V: Create a PowerPoint to showcase your findings
1. You will use PowerPoint to create a presentation to give a visual representation of your findings.
2. You should have the following in the PowerPoint:
a. At least 5 slides
b. The 5th slide cannot be a simple THE END slide. It must be informative.
c. You must have either a transition or an animation on each slide.
d. You must include at least 1 chart from your project. (Hint: copy/paste from Excel to PowerPoint)
Normal
0
false
false
false
EN-US
X-NONE
X-NONE
/* Style Definitions */
table.MsoNormalTable
{mso-style-name:"Table Normal";
mso-tstyle-rowband-size:0;
mso-tstyle-colband-size:0;
mso-style-noshow:yes;
mso-style-priority:99;
mso-style-parent:"";
mso-padding-alt:0in 5.4pt 0in 5.4pt;
mso-para-margin-top:0in;
mso-para-margin-right:0in;
mso-para-margin-bottom:10.0pt;
mso-para-margin-left:0in;
line-height:115%;
mso-pagination:widow-orphan;
font-size:11.0pt;
font-family:"Calibri","sans-serif";
mso-ascii-font-family:Calibri;
mso-ascii-theme-font:minor-latin;
mso-hansi-font-family:Calibri;
mso-hansi-theme-font:minor-latin;}
Evaluation
Normal
0
false
false
false
EN-US
X-NONE
X-NONE
/* Style Definitions */
table.MsoNormalTable
{mso-style-name:"Table Normal";
mso-tstyle-rowband-size:0;
mso-tstyle-colband-size:0;
mso-style-noshow:yes;
mso-style-priority:99;
mso-style-parent:"";
mso-padding-alt:0in 5.4pt 0in 5.4pt;
mso-para-margin-top:0in;
mso-para-margin-right:0in;
mso-para-margin-bottom:10.0pt;
mso-para-margin-left:0in;
line-height:115%;
mso-pagination:widow-orphan;
font-size:11.0pt;
font-family:"Calibri","sans-serif";
mso-ascii-font-family:Calibri;
mso-ascii-theme-font:minor-latin;
mso-hansi-font-family:Calibri;
mso-hansi-theme-font:minor-latin;}
table.MsoTableGrid
{mso-style-name:"Table Grid";
mso-tstyle-rowband-size:0;
mso-tstyle-colband-size:0;
mso-style-priority:59;
mso-style-unhide:no;
border:solid black 1.0pt;
mso-border-themecolor:text1;
mso-border-alt:solid black .5pt;
mso-border-themecolor:text1;
mso-padding-alt:0in 5.4pt 0in 5.4pt;
mso-border-insideh:.5pt solid black;
mso-border-insideh-themecolor:text1;
mso-border-insidev:.5pt solid black;
mso-border-insidev-themecolor:text1;
mso-para-margin:0in;
mso-para-margin-bottom:.0001pt;
mso-pagination:widow-orphan;
font-size:11.0pt;
font-family:"Calibri","sans-serif";
mso-ascii-font-family:Calibri;
mso-ascii-theme-font:minor-latin;
mso-hansi-font-family:Calibri;
mso-hansi-theme-font:minor-latin;}
|
Rubric: Description |
Points Available |
|
Excel Worksheet #1 – Data Collection |
|
|
Correctly named tab DATA |
2 |
|
Color the tab (any color you want) |
1 |
|
4 Complete meals entered correctly 5 pts each |
20 |
|
Correct total line for each meal 10 pts each |
40 |
|
Correct formula: Calories from Fat 1 pt per entry |
16 |
|
Correct formula: Calories from Carbs 1 pt per entry |
16 |
|
Correct formula: % Calories from Fat 1 pt per entry |
16 |
|
Correct formula: % Calories from Carbs 1 pt per entry |
16 |
|
Excel Worksheet #2 – Charts |
|
|
Correctly named tab CHARTS |
2 |
|
Color the tab |
1 |
|
Chart 1: Chart of 1st meal selected |
5 |
|
Chart 2: Chart of 2nd meal selected |
5 |
|
Chart 3: Comparison of meal items side by side |
5 |
|
Chart 4: Comparison of two meal totals |
5 |
|
Excel Worksheet #3 – USDA findings |
|
|
Correctly named tab USDA |
2 |
|
Color the tab |
1 |
|
Complete chart of information (1pt per entry) |
15 |
|
|
|
|
Total Points Excel Portion |
168 |
|
|
|
|
Word Portion |
|
|
Formatting: |
|
|
Narrow margins |
2 |
|
3 line heading (name/date/period) |
3 |
|
3 line heading : Single spacing (remove space after) |
2 |
|
3 line heading : Comic Sans font; 11 pt |
2 |
|
3 line heading : In upper right |
1 |
|
Title : Comic Sans; 14 pt |
2 |
|
Title : bold |
1 |
|
Title : centered |
1 |
|
Title : underlined |
1 |
|
Body : Comic Sans; 12 pt |
2 |
|
Body : Justified alignment (align on both margins) |
1 |
|
Paragraph 1 – Intro |
5 |
|
Paragraph 2 – details about your findings |
5 |
|
Paragraph 3 – conclusion |
5 |
|
Correct indentation |
3 |
|
Include Chart from Excel |
10 |
|
MINUS: 1 pt per misspelling, incorrect capitalization, punctuation |
-1 per error |
|
Total Word Portion |
46 |
|
|
|
|
PowerPoint Portion |
|
|
5 slides (picture/clipart and text on each slide) 2 pts/slide |
10 |
|
Transition or animation on each slide 2 pts/slide |
10 |
|
Include the chart you created in Excel |
10 |
|
Informative (you have valid information) |
10 |
|
Total PowerPoint Portion |
40 |
|
|
|
|
Total Excel Portion |
168 |
|
Total Word Portion |
46 |
|
Total PowerPoint Portion |
40 |
|
Final Project Total |
254 |
Conclusion
Congratulations on completing your quest to find out about the nutritional value of restaurants and what the USDA recommendations are for the daily nutritional requirements for you.
Continue to be conscious of what you are ordering and eating, as well as what kind of physical activity you are involved in.
Always keep in mind that healthy eating and physical activity are key to having a healthy body. If you feel you need further information on your nutritional intake, you should always consult your parent and doctor.
Credits
I found the idea for this project many years ago, and unfortunately cannot find the site that I got the idea from to give them credit. It started out as a much smaller project, and has gotten more involved each year.
Teacher Page
The purpose of this webquest is for students to research the nutritional value of restaurant meals and the USDA food and nutrition information about daily recommendations for eating and exercise. They then will use the data found to critically compare two restaurant meals and form conclusions about how they are eating and exercising, and make some conclusions about their current habits.
Standards that would be covered:
CCSS.ELA-Literacy.RST.6-8.7
Integrate quantitative or technical information expressed in words in a text with a version of that information expressed visually (e.g., in a flowchart, diagram, model, graph, or table).
CCSS.ELA-Literacy.RST.6-8.8
Distinguish among facts, reasoned judgement based on research findings, and speculation in a text.